Visualization with Matplotlib
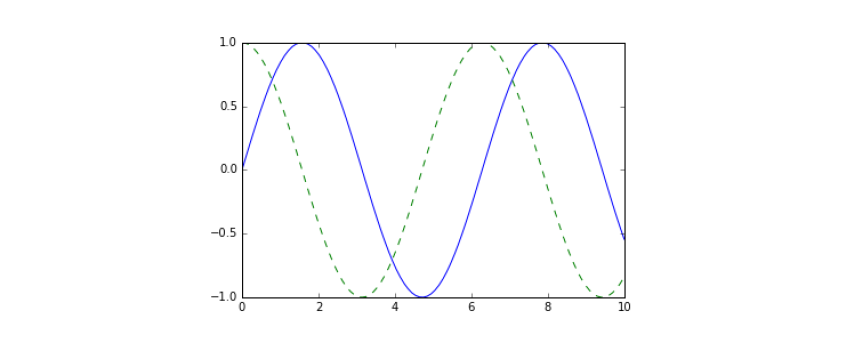
Figure 4-2. PNG rendering of the basic plot
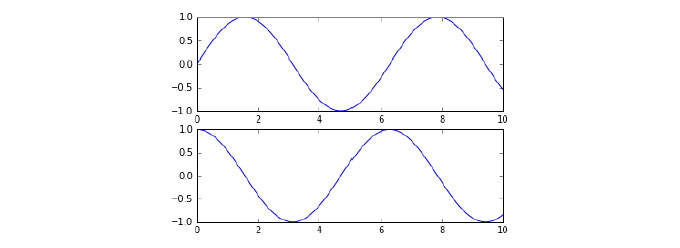
Figure 4-4. Subplots using the object-oriented interface
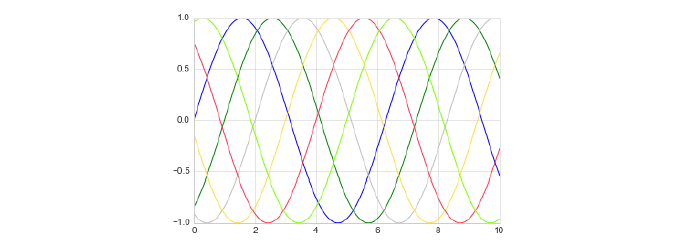
Figure 4-9. Controlling the color of plot elements
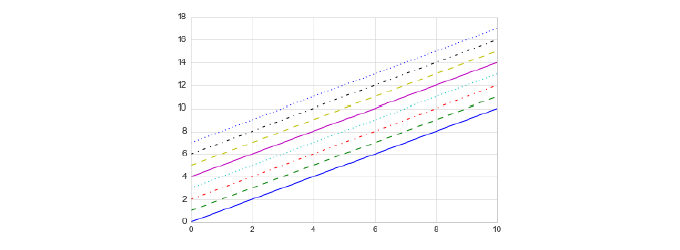
Figure 4-10. Example of various line styles
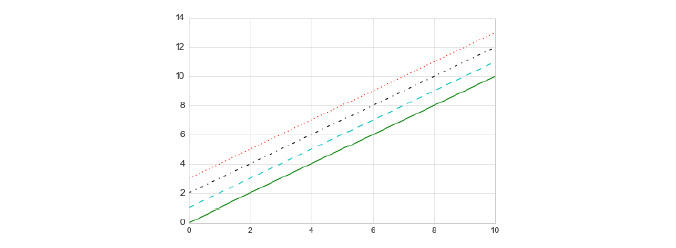
Figure 4-11. Controlling colors and styles with the shorthand syntax
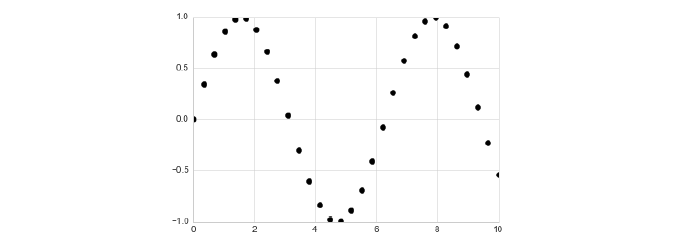
Figure 4-20. Scatter plot example
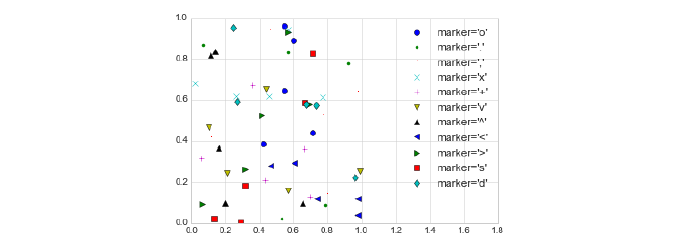
Figure 4-21. Demonstration of point numbers
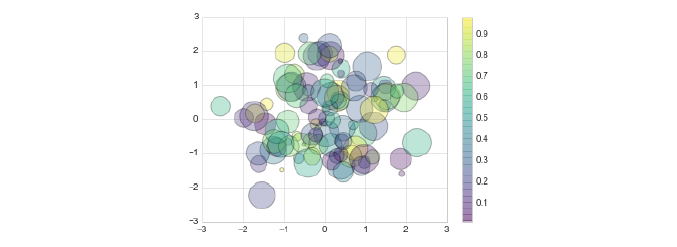
Figure 4-25. Changing size, color, and transparency in scatter points
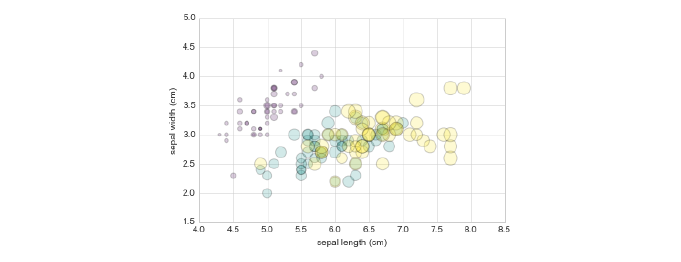
Figure 4-26. Using point properties to encode features of the Iris data
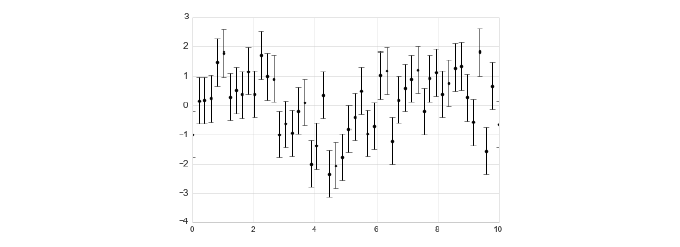
Figure 4-27. An errorbar example
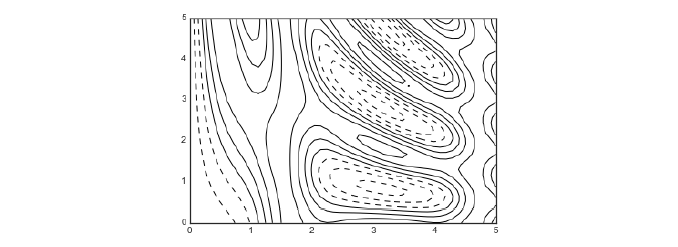
Figure 4-30. Visualizing three-dimensional data with contours